Shifting House Prices
After two years of inclining house prices, we are now experiencing a very welcome shift in the marketplace GTA and further out.
Although we are seeing a decline in prices right now, we need to be reminded of the increase over the past two years.
Two graphs below are excellent reminders….
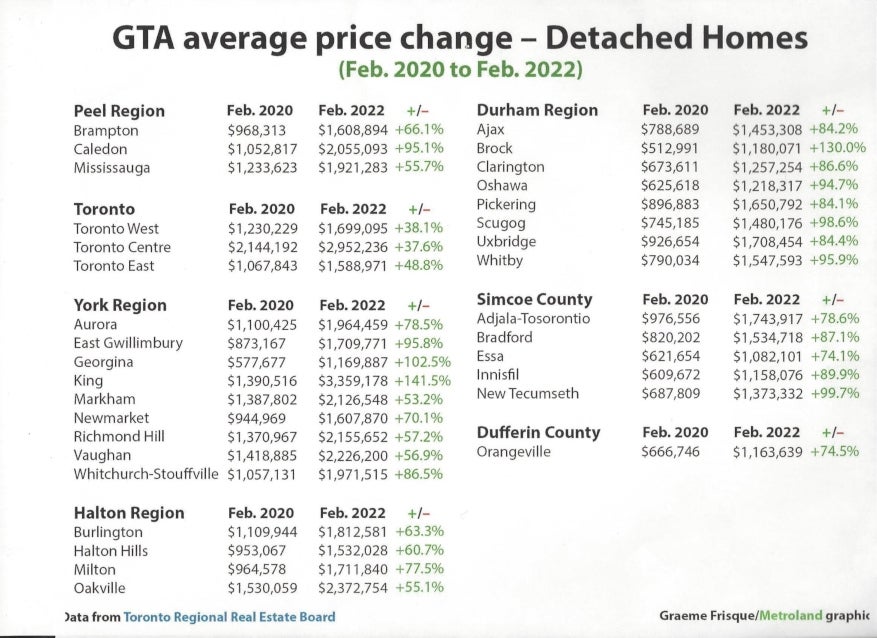
The first graph is one published in February 2022 showing the percentage increase of various regions across the GTA from February 2020 to February 2022.
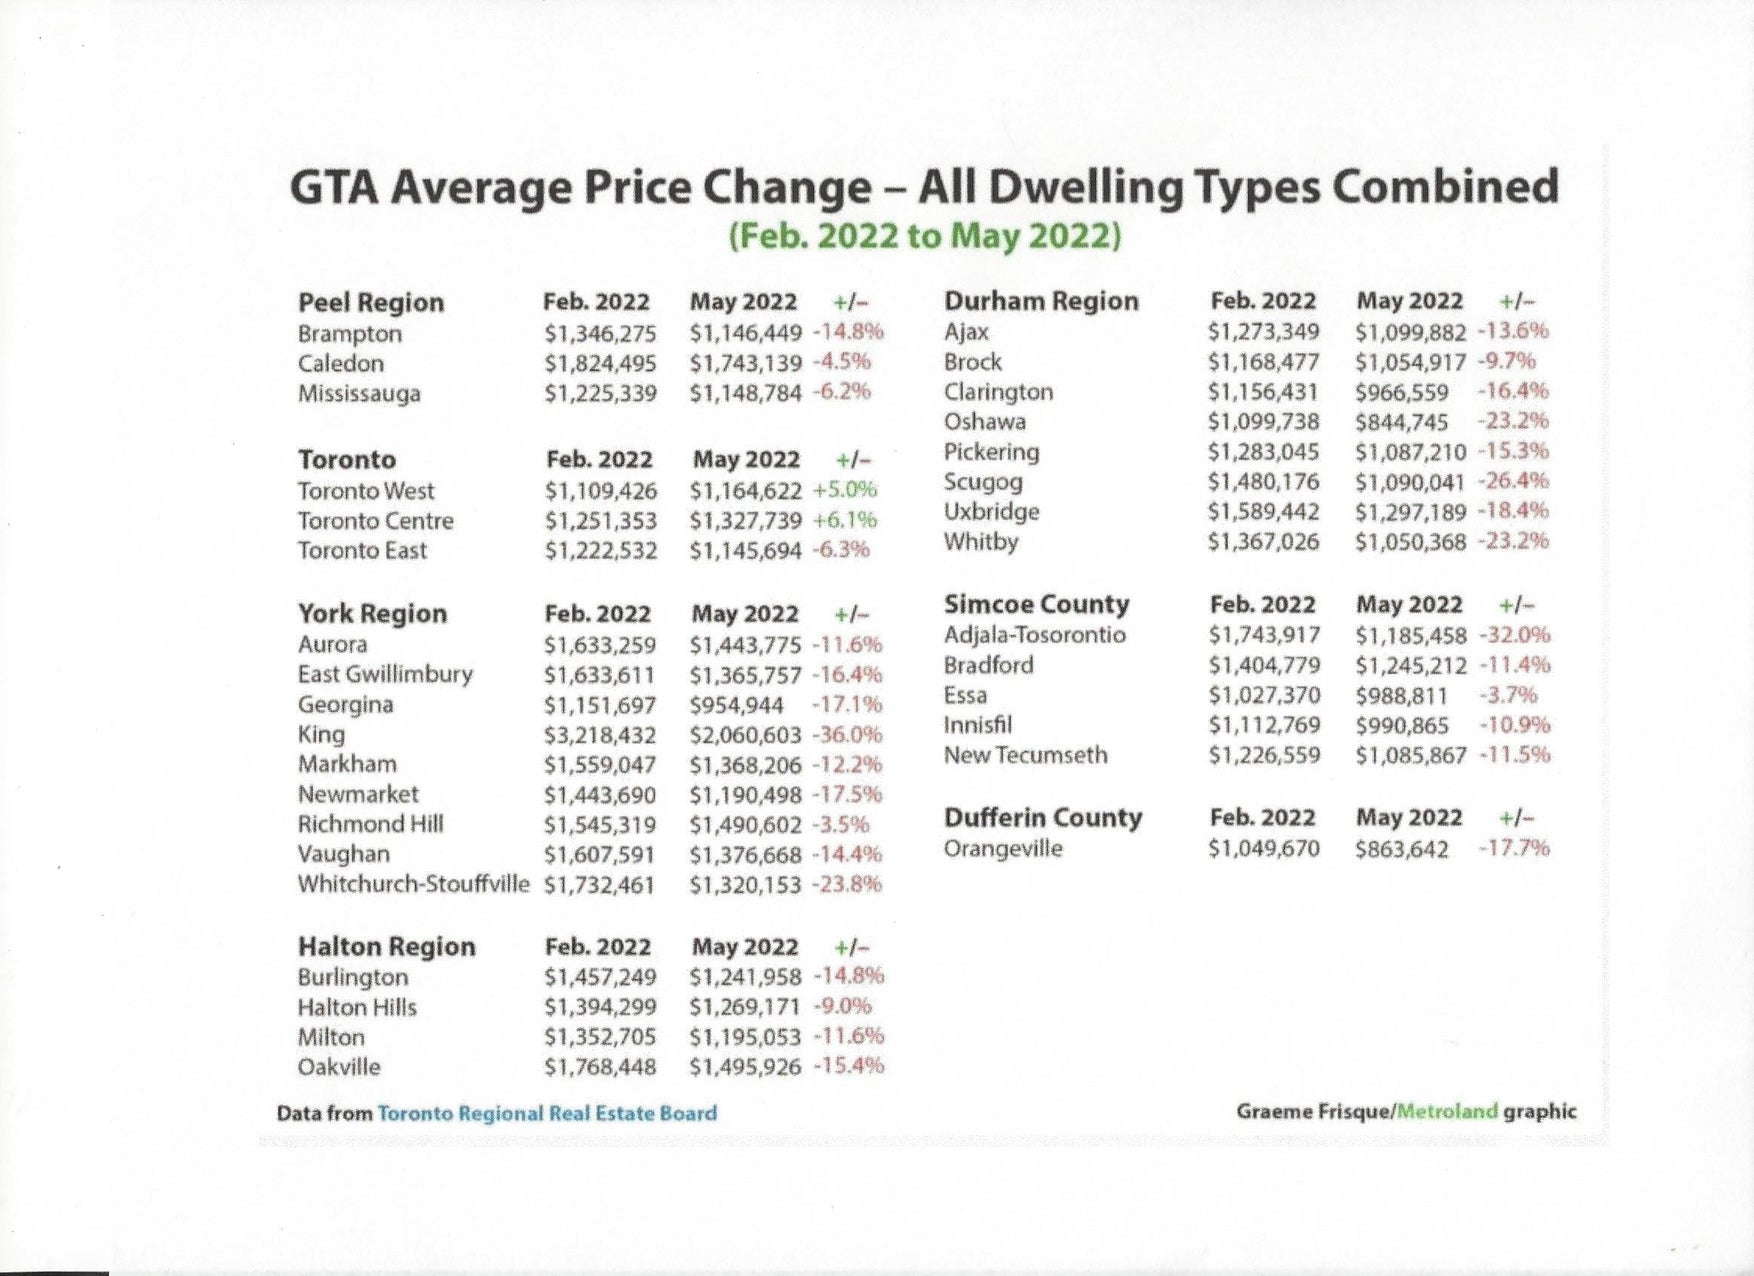
The second graph is one published in May of 2022 and shows the percentage decrease or increase from February 2022 to May 2022.
Some interest points:
- Toronto West and Centre are the only areas that didn’t have a decline in prices from Feb 2022 to May 2022 – everywhere else experiences a decline.
- The township of King experienced the highest increase over the two-year period of 141.5%; it also experience the highest decline from Feb to May 2022
- Essa saw the smallest decline in the past few months
- The township of King experienced the highest increase over the two-year period of 141.5%; it also experience the highest decline from Feb to May 2022
- Essa saw the smallest decline in the past few months
If you are considering buying or selling over the next few months, be sure to dig into your micro-market, as market changes vary greatly by neighbourhoods and types of homes.